The vmstat command in Linux is an essential tool for monitoring and managing the performance of the system. Whether you are a system administrator or a developer, the vmstat command provides valuable information that can help you optimize system performance, identify performance issues, and troubleshoot problems. Moreover, In this article, I will describe all the features and uses of the vmstat command in Linux with multiple examples.
A. Description
The vmstat command in Linux is a powerful tool that provides detailed information about system performance, including memory usage, CPU utilization, and Input/Output (I/O) statistics. This command provides real-time information about various aspects of the system, which makes it a valuable tool for system administrators and developers. With the vmstat command, you can easily identify performance bottlenecks, monitor resource utilization, and troubleshoot various performance-related issues on your Linux system
B. Syntax
The syntax of the vmstat command in Linux is simple, as shown below.
vmstat [OPTION]... [DELAY [COUNT]]C. Options
The vmstat command has multiple options available. Here, I have listed a few of them. However, you can learn more about the vmstat command, its options and their uses by checking the man page.
man vmstatUseful Options
- -a, –active: Displays active and inactive memory.
- -f, –forks: Displays the number of forks since boot.
- -m, –slabs: Displays slab info.
- -s, –stats: Displays a table of various event counters and memory statistics.
- -d, –disk: Displays statistics on disk activities.
- -D, –disk-sum: Displays statistics on paging activities.
- -S, –unit character: Displays information in MB or KB.
- -t, –timestamp: Displays a timestamp with each report.
- -h, –help: Displays the help page
- -V, –version: Displays version information.
Practical Examples of the “vmstat” Command in Linux
In Linux, the vmstat command is a helpful tool to monitor system performance and resource usage. In the section below, I will show you some of the most useful applications for the vmstat command in Linux.
Example 1: Display System Statistics With “vmstat” Command in Linux
You can display the system statistics by simply running the vmstat command in Linux. Here, I will show you the system statistics of my Linux system. You can do the same for your system by following the steps mentioned below.
Steps to Follow >
➊ First, open the Ubuntu Terminal.
➋ Then, execute the following command.
vmstat➌ Finally, press the ENTER key.
Output >
In the following image, you can see that I have displayed the system statistics of my system.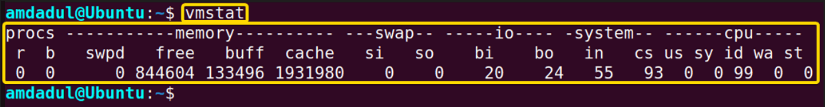
Example 2: Display the Amount of Active and Inactive Memory
Monitoring the memory usage of your system is important to ensure its smooth functioning and avoid performance issues. In Linux, you can display the amount of active and inactive memory using the -a option with the vmstat command. In this article, I will guide you through the process of displaying the amount of active and inactive memory in Linux.
Steps to Follow >
➊ At first, open the Ubuntu Terminal.
➋ Then, execute the following command.
vmstat -a➌ Then, press the ENTER key.
Output >
In the following image, you can see that I have displayed the amount of active and inactivate memory in kilobytes (kb).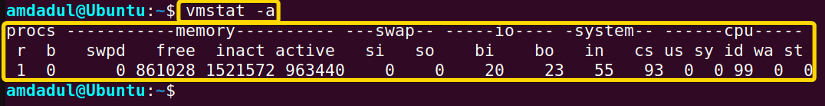
Similar Readings
- The “service” Command in Linux [6 Practical Examples]
- The “sestatus” Command in Linux [4 Practical Examples]
- The “shutdown” Command in Linux [7 Practical Examples]
- The “finger” Command in Linux [6 Practical Examples]
Example 3: Display Memory and Scheduling Statistics Using the “vmstat” Command in Linux
Memory and scheduling statistics are key indicators of a computer system‘s performance. These statistics provide information about a system‘s memory usage and task-scheduling capabilities. Here, I will show you the memory and scheduling statistics of my system, which can be achieved by following the mentioned steps.
Steps to Follow >
➊ First, open the Ubuntu Terminal.
➋ Next, copy the below command in the command prompt.
vmstat -s➌ Finally, tap the ENTER button.
Output >
You can see in the image below, I have displayed the memory and scheduling status of my system.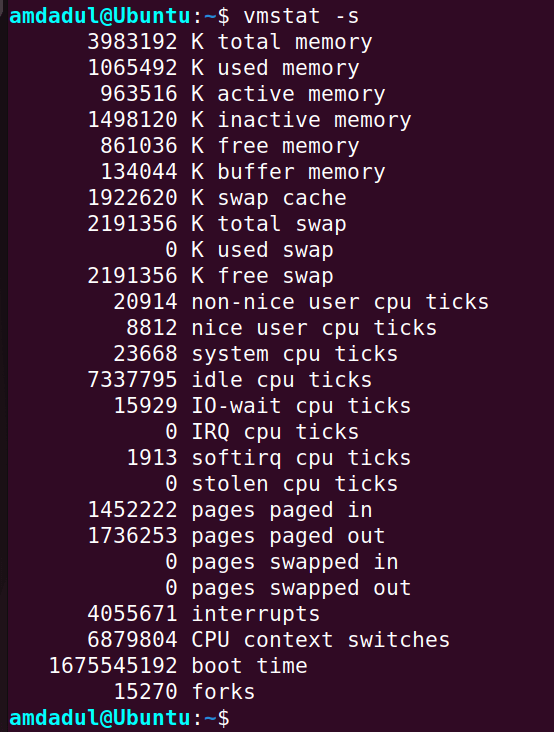
Example 4: Display All Disk Statistics Using the “vmstat” Command in Linux
The vmstat command with the -d option displays disk statistics in Linux. The -d option shows the number of reads and writes, in blocks per second, that have been issued to the disk. You can get the statistics of all disks by following the steps given below.
Steps to Follow >
➊ At first, open the Ubuntu Terminal.
➋ Then, type the following command into the command prompt:
vmstat -d➌ Now, press the ENTER button.
Output >
In the image below, you can see the statistics of all of my Linux machine’s disks.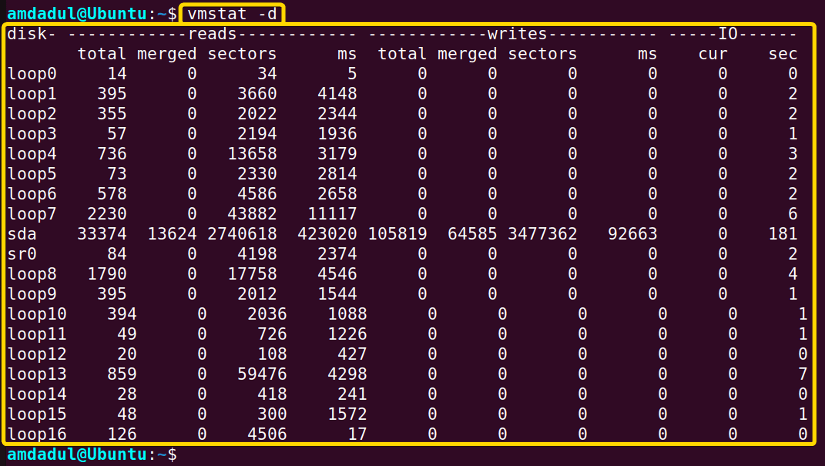
Similar Readings
- The “free” Command in Linux [8 Practical Examples]
- The “getent” Command in Linux [11 Practical Examples]
- The “firewall-cmd” Command in Linux [7 Practical Examples]
- The “uname” Command in Linux [11 Practical Examples]
Example 5: Repeatedly Display the Memory Status in Megabytes
To display the memory status in megabytes multiple times, you can use the vmstat command along with the option -S & M and two arguments, i.e., delay and count. So the syntax will be as below.
vmstat -S M delay countIn this example, I’ll show the memory status in megabytes three times over the course of a ten-second period. You can do the same by following the steps below.
Steps to Follow >
➊ At first, Launch the Ubuntu Terminal.
➋ Then, execute the following command.
vmstat -S M 10 3➌ Then, press the ENTER key.
Output >
In the following image, you can see that I have displayed the memory status three times in megabyte units.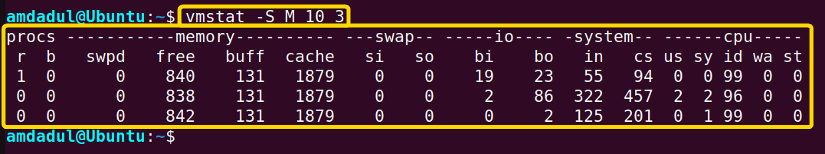
Example 6: Display Timestamp Information of Each Report
To display timestamp information for each report in the output of the vmstat command in Linux, the -t or –timestamp option can be utilized. This option adds the current date and time to each iteration of the output, providing a clear indication of when the statistics were collected. In this example, I will show you the timestamp information of a report in the output of the vmstat command, which can be achieved by following the steps below.
Steps to Follow >
➊ Open the Ubuntu Terminal.
➋ Next, run any one of the following commands.
vmstat -tAlternatively,
vmstat --timestamp➌ Press the ENTER key.
Output >
The output will show the current status of the system‘s memory, swap, block IO, traps, and CPU activity, along with the date and time of the update.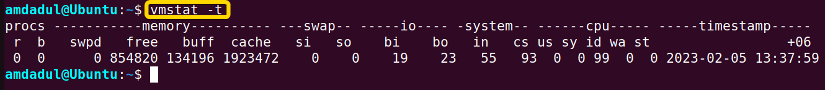
Conclusion
The vmstat is a versatile performance monitoring tool in Linux systems. Regardless of your level of experience, vmstat will provide detailed information about your system‘s performance. In addition, vmstat can help you diagnose and resolve performance problems by giving you a detailed picture of various system resources and utilization. By understanding the basics of vmstat, you can take full advantage of this tool, and effectively monitor and manage the performance of your Linux system.
Similar Readings
- The “dmesg” Command in Linux [7+ Practical Examples]
- The “install” Command in Linux [6+ Practical Examples]
- The “reboot” Command in Linux [3 Practical Examples]
- The “top” Command in Linux [8 Practical Examples]
- The “htop” Command in Linux [7 Practical Examples]
- The “enable” Command in Linux [6 Practical Examples]
FUNDAMENTALS A Complete Guide for Beginners